Mapping Jira Epic Dependencies: A Link Matrix, a Crossing-Free Graph and a Build Order
A Jira Epic with eight or nine child tasks doesn’t look complicated in the issue list. Then you start linking them - this blocks that, that’s blocked by two others, one of them also relates to a task in a different swimlane - and the list view stops being useful. You can see each link individually, but you can’t see the shape of the dependencies: what has to happen first, what’s actually parallelizable, and what order minimizes idle time.
I already had a small Jira automation script, create_test_jiras.py, that creates linked test issues and publishes a link matrix to Confluence. It had a build_link_matrix() function that was almost exactly what I needed - I just needed to point it at an arbitrary Epic, render the result somewhere more useful than Confluence, and add a diagram and a recommended order on top. That became epic_dependency_matrix.py. This post walks through building it, including the Mermaid version I shipped first and then ripped out.
The Starting Point: A Link Matrix That Already Existed
build_link_matrix() was already doing the hard part - for every pair of issues, it fetches Jira’s issuelinks field and works out the label connecting them (blocks, is blocked by, or a bullet • if there’s no link):
def build_link_matrix(issue_keys: list[str]) -> dict:
    """
    Build a link matrix for the given issue keys.
    Returns {(row_key, col_key): label} where label is the link type
    or '•' if no link / diagonal.
    """
    all_links: dict[str, list[dict]] = {}
    for key in issue_keys:
        all_links[key] = get_issue_links(key)

    matrix: dict[tuple[str, str], str] = {}
    for row_key in issue_keys:
        for col_key in issue_keys:
            if row_key == col_key:
                matrix[(row_key, col_key)] = "•"
                continue
            label = "•"
            for link in all_links[row_key]:
                if "outwardIssue" in link:
                    target = link["outwardIssue"]["key"]
                    if target == col_key:
                        label = link["type"].get("outward", link["type"]["name"])
                        break
                if "inwardIssue" in link:
                    source = link["inwardIssue"]["key"]
                    if source == col_key:
                        label = link["type"].get("inward", link["type"]["name"])
                        break
            matrix[(row_key, col_key)] = label
    return matrix
epic_dependency_matrix.py reuses this directly - it just runs a different JQL query (parent = <epic> ORDER BY key ASC) to find the issues, then builds on top of the matrix that comes back.
Rendering the Matrix: From “Looks Fine” to “Actually Legible”
My first pass put full issue summaries in the row and column headers. That works for a toy example with three issues. It falls apart immediately with real summaries, which are often 60+ characters - the table either wraps unreadably or the columns become so wide the grid is useless. The fix was to use issue keys only (TP-2, not TP-2 Add login validation) and keep a separate Key/Summary/Priority table above it for reference.
The bigger problem was that plain GitHub-flavored Markdown tables don’t reliably show vertical cell borders - different renderers style them differently, and in at least one viewer the grid looked like loosely-aligned text rather than a matrix. The fix was to stop relying on the renderer and draw the borders myself, as a fixed-width ASCII grid inside a fenced code block:
def render_grid_table(row_header: str, issue_keys: list[str], matrix: dict) -> str:
    row_width = max(len(row_header), *(len(k) for k in issue_keys))
    col_width = {
        col: max(len(col), *(len(matrix[(row, col)]) for row in issue_keys))
        for col in issue_keys
    }

    def rule(char: str) -> str:
        segments = [char * (row_width + 2)] + [char * (col_width[c] + 2) for c in issue_keys]
        return "+" + "+".join(segments) + "+"

    def row_line(label: str, cells: list[str]) -> str:
        parts = [f" {label.ljust(row_width)} "]
        parts += [f" {cell.ljust(col_width[c])} " for c, cell in zip(issue_keys, cells)]
        return "|" + "|".join(parts) + "|"

    border = rule("-")
    lines = [border, row_line(row_header, issue_keys), border]
    for row_key in issue_keys:
        cells = [matrix[(row_key, col_key)] for col_key in issue_keys]
        lines.append(row_line(row_key, cells))
        lines.append(border)
    return "\n".join(lines)
Wrapped in a code fence, this renders identically everywhere - VS Code, GitHub, a plain text editor - because it’s just monospace text with literal +/-/| characters, not something a renderer has to interpret.
The First Diagram: Mermaid, and Why It Wasn’t Enough
A matrix tells you whether two issues are linked. It doesn’t tell you the shape of the dependency graph at a glance. The obvious next step was a flowchart, and the obvious tool was Mermaid - it’s plain text, GitHub and Confluence both render it natively, and there’s no extra binary to install. My first version walked the matrix once, building a node per issue (labelled with its key and priority) and an edge per blocks relationship:
def matrix_to_mermaid(issue_keys, matrix, priorities):
    def node_id(key):
        return key.replace("-", "_")  # Mermaid IDs don't like hyphens

    lines = ["graph LR"]
    for key in issue_keys:
        priority = priorities.get(key, "")
        label = f"{key}<br/>{priority}" if priority else key
        lines.append(f'    {node_id(key)}["{label}"]')

    for blocker, blocked in blocks_edges:
        lines.append(f"    {node_id(blocker)} --> {node_id(blocked)}")
    for a, b, label in other_edges:
        lines.append(f"    {node_id(a)} -.{label}.- {node_id(b)}")
    return "\n".join(lines)
This worked, in the sense that it produced a valid diagram. But two separate problems showed up almost immediately.
Problem One: It Doesn’t Render Everywhere You’d Expect
VS Code’s built-in Markdown preview (Ctrl+Shift+V) doesn’t render fenced ```mermaid blocks out of the box - you need the bierner.markdown-mermaid extension. I had it installed already, and the preview still showed a blank panel where the diagram should be. Rather than guess, I rendered the exact same Mermaid source independently through mermaid-cli to confirm the syntax itself was valid:
npx --yes @mermaid-js/mermaid-cli -i diagram.mmd -o diagram.svg -b whiteThat produced a correct SVG, which told me the problem was the preview/theme, not the generated content - a useful lesson in isolating “is my output wrong” from “is the thing rendering my output behaving.” The practical fix was to also render a static image as a fallback, using the same mermaid-cli call from inside the script. That ran into a Windows-specific gotcha: calling subprocess.run(["npx", ...]) directly threw FileNotFoundError: [WinError 2], because npx on Windows is a .CMD shim and Python’s subprocess with shell=False won’t resolve it. The fix is one line - resolve the real path first:
npx = shutil.which("npx")   # resolves to npx.CMD on Windows
subprocess.run([npx, "--yes", "@mermaid-js/mermaid-cli", ...])
Problem Two: The Layout Has Avoidable Crossings
Once the image pipeline worked, the actual diagram quality became the issue. Even for a simple eight-node, ten-edge dependency graph, Mermaid’s bundled layout engine (dagre) produced a flowchart with visible, avoidable edge crossings:
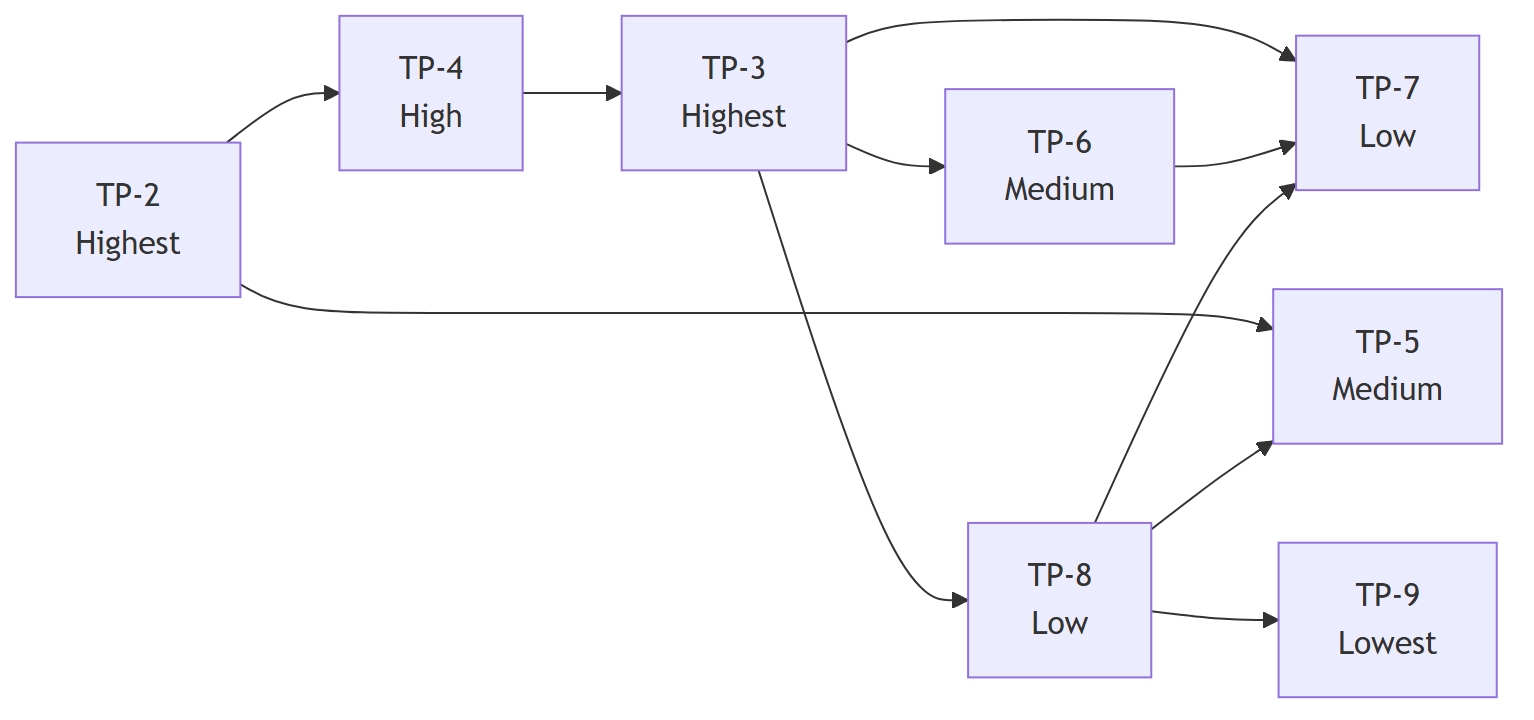 Same graph, same data -
 dagre’s single-pass heuristic leaves three crossings that a better layout algorithm avoids entirely.
Before reaching for a different tool, I wanted to know whether a crossing-free drawing was even possible for this graph, or whether I was chasing something that couldn’t exist. networkx already had the answer built in:
import networkx as nx

G = nx.DiGraph(edges)
is_planar, _ = nx.check_planarity(G.to_undirected())
print(is_planar)  # True
The graph was planar. A zero-crossing layout existed in principle - dagre simply wasn’t finding it, because it trades layout quality for speed.
Switching to Graphviz
Graphviz’s dot has spent decades being the default tool for exactly this kind of layered directed graph, with a meaningfully more thorough crossing-minimization heuristic than dagre’s. Generating the diagram source looked almost identical to the Mermaid version - same edge-walking logic, different output syntax:
def matrix_to_dot(issue_keys, matrix, priorities):
    lines = [
        "digraph G {",
        "    rankdir=LR;",
        '    node [shape=box, style=filled, fillcolor="#ECECFF", '
        'color="#9370DB", fontname="Helvetica"];',
    ]
    for key in issue_keys:
        priority = priorities.get(key, "")
        label = f"{key}\\n{priority}" if priority else key
        lines.append(f'    "{key}" [label="{label}"];')

    for blocker, blocked in blocks_edges:
        lines.append(f'    "{blocker}" -> "{blocked}";')
    for a, b, label in other_edges:
        lines.append(f'    "{a}" -> "{b}" [dir=none, style=dashed, label="{label}"];')
    lines.append("}")
    return "\n".join(lines)
I pulled the shared edge-walking logic (deduplicating each pair, splitting blocks edges from other relation types) into a build_diagram_edges() helper so both the Mermaid and DOT generators consumed the same data instead of repeating the same loop twice.
Rendering turned out simpler than the Mermaid pipeline, too. dot reads DOT source from stdin, so there’s no temp file to create and clean up:
def render_dot_image(dot_src: str, image_path: str) -> bool:
    dot = shutil.which("dot")
    if not dot:
        print("  Warning: Graphviz 'dot' not found; skipping diagram image.")
        return False
    result = subprocess.run(
        [dot, "-Tsvg", "-o", image_path],
        input=dot_src, capture_output=True, text=True, timeout=60,
    )
    return result.returncode == 0
Same graph, same data, rendered through dot instead of dagre:
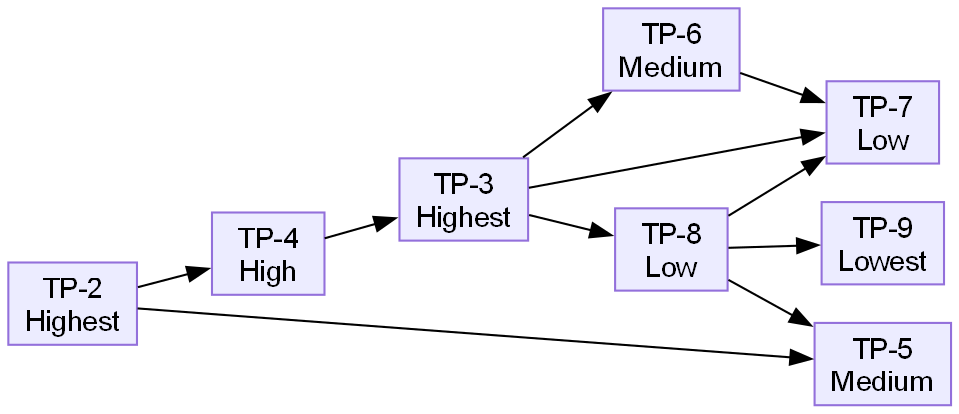 Zero crossings.
 dot’s network-simplex ranking plus iterative median-heuristic ordering found the planar embedding dagre missed.
This also quietly removed a dependency: the script no longer needs Node.js or mermaid-cli at all, since the only thing they were doing was rendering an image that dot now does directly.
The Windows PATH Gotcha, Round Two
Installing Graphviz should have been the easy part:
winget install Graphviz.GraphvizIt installed cleanly, but dot -V still came back “command not found” - in a brand new terminal, not just the one the install ran in. Checking both PATH scopes directly confirmed it:
[System.Environment]::GetEnvironmentVariable('Path','Machine')  # no Graphviz
[System.Environment]::GetEnvironmentVariable('Path','User')     # no Graphviz
The winget package simply doesn’t register its bin directory anywhere. The fix was to add it to the User PATH directly:
[System.Environment]::SetEnvironmentVariable(
    'Path',
    [System.Environment]::GetEnvironmentVariable('Path','User') + ';C:\Program Files\Graphviz\bin',
    'User'
)
This only affects new processes - any terminal or IDE window already open at the time has to be restarted to pick it up, which is worth documenting explicitly so future-me (or anyone else running the script) doesn’t waste time wondering why it “isn’t working” right after installing.
Removing Mermaid Entirely
With Graphviz rendering reliably, the Mermaid block I’d kept as a “portable fallback” stopped earning its place. In practice it just meant every generated report had a large, raw graph LR text block sitting underneath the actual image - noise nobody asked for once the primary path worked. I deleted matrix_to_mermaid() outright and replaced the fallback with a one-line note for the case where Graphviz genuinely isn’t installed:
if image_filename:
lines += [f"", ""]
else:
lines += [
"_Diagram image unavailable: Graphviz (`dot`) was not found on "
"PATH when this report was generated._",
"",
]It’s a small deletion, but it’s the kind of cleanup that’s easy to skip - the fallback wasn’t wrong, it just wasn’t needed anymore, and every “just in case” branch left in place is something the next reader has to understand and discount.
Suggesting a Build Order
A diagram answers “what’s connected to what.” It doesn’t answer “what should I actually start working on.” For that, the script computes a topological order - Kahn’s algorithm, with ties between unblocked tasks broken by Jira priority:
PRIORITY_RANK = {"Highest": 0, "High": 1, "Medium": 2, "Low": 3, "Lowest": 4}

def compute_schedule_order(issue_keys, matrix, priorities):
    blockers = build_blockers_map(issue_keys, matrix)
    remaining_blockers = {k: set(v) for k, v in blockers.items()}
    remaining = set(issue_keys)
    order = []

    def sort_key(key):
        rank = PRIORITY_RANK.get(priorities.get(key, ""), len(PRIORITY_RANK))
        return (rank, key)

    while remaining:
        ready = sorted((k for k in remaining if not remaining_blockers[k]), key=sort_key)
        if not ready:
            break  # circular dependency among the remaining issues
        chosen = ready[0]
        order.append(chosen)
        remaining.discard(chosen)
        for deps in remaining_blockers.values():
            deps.discard(chosen)

    unresolved = sorted(remaining)
    return order, unresolved, blockers
If remaining never empties out, the leftover issues are caught in a circular dependency - reported explicitly in the Markdown rather than silently dropped or causing an infinite loop. On the real TP-1 test epic this produced exactly the order you’d hope for: TP-6 (Medium) gets scheduled before TP-8 (Low) the moment both become unblocked, and the Lowest-priority task gets pushed to the very end even though it became technically unblocked earlier. Here’s the actual Suggested Scheduling Order section from the generated TP-1_dependency_matrix.md:
1. TP-2 (Priority: Highest) — blocked by: none
2. TP-4 (Priority: High) — blocked by: TP-2
3. TP-3 (Priority: Highest) — blocked by: TP-4
4. TP-6 (Priority: Medium) — blocked by: TP-3
5. TP-8 (Priority: Low) — blocked by: TP-3
6. TP-5 (Priority: Medium) — blocked by: TP-2, TP-8
7. TP-7 (Priority: Low) — blocked by: TP-3, TP-6, TP-8
8. TP-9 (Priority: Lowest) — blocked by: TP-8
Step 4 and 5 are the interesting pair: both TP-6 and TP-8 become unblocked at the same point (the moment TP-3 finishes), and the priority tie-break puts TP-6 (Medium) ahead of TP-8 (Low). Step 8 shows the other side of that rule - TP-9 is unblocked as soon as TP-8 finishes, well before step 8, but its Lowest priority means everything else with outstanding blockers still gets picked first.
Alternative Approaches: Mermaid vs. Graphviz vs. Rolling Your Own
This is worth a direct comparison, because none of these is a strictly better choice in every context - the right one depends on where the diagram needs to live.
Mermaid + dagre
- Advantages: it’s plain text, which means zero extra system dependencies for anyone viewing it on GitHub, GitLab, Confluence, Notion, or any other platform with native Mermaid support. You can paste the source directly into an issue comment and it just draws itself. No binary to install, no PATH to configure.
- Disadvantages:
dagre’s layout heuristic is fast but not thorough - it will readily leave avoidable crossings even on small, genuinely planar graphs. Producing a static image (for viewers without Mermaid support, like VS Code’s default preview) requires a separate Node.js-based render step viamermaid-cli, which on Windows means navigating thenpx/.CMDsubprocess quirk this project actually hit.
Graphviz dot
- Advantages: a dramatically better crossing-minimization heuristic (network-simplex ranking plus iterative median-heuristic ordering), decades of being the default tool for exactly this diagram shape, and a genuinely simpler rendering path - DOT source piped straight to
dotvia stdin, no temp files, no Node.js dependency at all. - Disadvantages: it’s a separate system binary, not a text format any platform renders natively. You lose the “paste the text, it draws itself” portability Mermaid has on GitHub/Confluence, and - as this project found firsthand - even the installer story has rough edges (winget’s package not registering PATH).
Hand-rolled layout (considered, not built)
For very small graphs (the realistic case for a single Epic’s child tasks), it’s feasible to compute rank assignment and crossing-minimizing node order directly in Python - networkx was already a dependency, and exact permutation search is cheap when each rank only has a handful of nodes. This would give the tightest possible guarantee: the true minimum crossings for a given rank assignment, not just “whatever a heuristic found.” It was deliberately not built here, because Graphviz already gets there in practice for graphs this size, and writing a layered-graph-and-SVG renderer from scratch is a meaningfully larger maintenance burden for a marginal gain over a well-established existing tool.
One more option surfaced during research but wasn’t pursued: Mermaid has an opt-in elk layout engine (@mermaid-js/layout-elk) with a more sophisticated crossing minimizer than dagre. Whether mermaid-cli’s command-line tool supports registering it without custom Puppeteer scripting wasn’t something I could confirm quickly, so rather than spend time on an uncertain path, switching to a tool I could verify immediately (Graphviz, already proven by hand) won.
Challenges Along the Way
A hardcoded API token, discovered mid-task. While reading create_test_jiras.py as the basis for the new script, the Atlassian API token was sitting in plaintext at the top of the file - and already committed to git history. Fixing the current file (moving credentials to environment variables loaded via python-dotenv, adding .env/.gitignore) was straightforward; the token already being in git history is a separate problem that needs an actual token rotation, not a code fix, and I flagged that explicitly rather than treating the .env migration as a complete solution.
Windows subprocess + .CMD shims. Both the Mermaid and (briefly) the Graphviz integration hit the same root cause from different angles: calling a Node-installed or winget-installed tool by its bare name through subprocess.run([...], shell=False) fails on Windows when the tool is actually a .CMD/.BAT shim. shutil.which() resolves the real, directly-executable path and sidesteps the problem entirely - a small habit worth keeping any time a script shells out on Windows.
Proving a diagram is “fine” when it doesn’t look fine. The VS Code preview showing a blank panel for a valid Mermaid block was the trickiest moment to debug, because the obvious assumption - “my generated syntax must be wrong” - was false. Rendering the same source independently through mermaid-cli and getting a correct SVG back was what separated “my code is broken” from “the viewer isn’t doing what I expect,” which turned out to be the actual situation.
Key Takeaways
- A bundled layout engine optimizes for “fast and good enough,” not “best possible.” If a diagram’s readability matters and the graph is small, it’s worth checking whether a dedicated tool produces a meaningfully better result before tuning the bundled one’s config knobs.
- Check whether the ideal outcome is even achievable before chasing it.
networkx.check_planarity()answered “is a zero-crossing layout possible here?” before any layout code was written - cheap to check, and it turns “maybe I can fix this” into either “yes, worth pursuing” or “no, aim for minimal instead.” - Installer success and tool usability are different claims.
winget installexiting cleanly didn’t meandotwas on PATH. Verify the actual capability (dot -V) rather than trusting the package manager’s exit code. - Prefer stdin/stdout over temp files when a CLI tool supports it. Graphviz reading DOT source from stdin and writing the image directly meant no temp file to create, track, and clean up - simpler and harder to get wrong than the equivalent file-based pipeline.
shutil.which()beforesubprocess.run()on Windows, every time you shell out to a Node/npm-installed or winget-installed tool. The.CMD/.BATshim problem is generic, not specific to Mermaid or Graphviz - it’ll resurface with any tool installed that way.- Delete the fallback once the primary path is reliable. A “just in case” code branch that’s no longer needed isn’t neutral - it’s extra surface area for the next reader (including future you) to read, understand, and discount before they can trust what the code actually does.
The Code
This project lives in a private local repository (not currently pushed to GitHub). The relevant files:
epic_dependency_matrix.py- the script described in this post: link matrix, Graphviz diagram, scheduling ordercreate_test_jiras.py- the original automation scriptepic_dependency_matrix.pyimportsbuild_link_matrix(),search_issues()and the Jira auth setup fromREADME.md- setup instructions, including the Graphviz/Windows PATH gotcha.env.example- the credential template (JIRA_BASE_URL,JIRA_EMAIL,JIRA_API_TOKEN)
Running it end-to-end against a real Epic is two commands once Graphviz and the Python dependencies are installed:
pip install requests python-dotenv
python epic_dependency_matrix.py TP-1
That produces TP-1_dependency_matrix.md with the link matrix, the Graphviz network diagram, and a suggested build order - everything you’d otherwise have to piece together by clicking through linked issues one at a time.